


Introduction
Light Detection and Ranging (LiDAR) is an emerging remote sensing tool for many disciplines. To put it simply, itÔÇÖs a laser scanning technology from which highly accurate ground surface models (topographic details) with elevation data can be created. The resultant data can be processed for analysis and interpretation in a Geographic Information System (GIS) software. Airborne Laser Scanning (ALS) is another term used for this, but in actuality refers to the overall method, whereas the LiDAR is the technology.
Therefore as the name suggests, Airborne Laser Scanning surveys refer to the use of LiDAR fitted to an aircraft or UAV from which extensive swathes of terrain can be scanned. This article will function as a brief introduction to this remote sensing method and its great potential for use in archaeology in Sri Lanka, through a working-progress case study.
Technology
Similar to Radar, it uses optical pulses fired from a laser to determine measurements. The resultant data are known as Point Clouds which contain measurements representing the position and elevation of the locations from which the optical pulse was reflected. The Point Cloud data are then filtered and interpolated to create high resolution Digital Elevation Models (DEMs), from which archaeological sites can be surveyed and mapped out.

LiDAR Applications in Archaeology
LiDARÔÇÖs use in archaeology has two applications. One is the scanning of a single monument to create a digital representation of it. This can be used for a variety of applications, such as for virtual reality, digital preservation of threatened heritage, and mapping for conservation and restoration.
The second is as a remote sensing tool for archaeological prospection. This is can be considered the most important application of the technology for archaeology. Its ability to cover vast areas in a short time together with its ability to filter out tree cover, has proven it to be an accurate and efficient method for surveying expansive forested regions for archaeological features (micro topographic features); a feat a traditional ground survey would be less equipped to do. LiDAR derived DEMs could have accuracies as high as 0.5×0.5m per pixel, enabling the detection of the smallest archaeological features. Although the technology has been around for some time, its wide application in archaeology as a surveying tool is only about a decade old.
Giving some examples, LiDAR surveys have been conducted extensively in Mesoamerican landscapes. The extensive forested regions of Central America, pertaining for example to the ancient Maya, have been a great source for testing out this technology, where entire urban and agricultural landscapes have been mapped out. One such study was conducted in 2009 in the Mayan site of Caracol, Belize, where a 200sqkm area was mapped out which revealed extensive monumental architecture, roads, residential settlements and agricultural terraces. Another example closer to home, was the LiDAR survey of the capital city of the Khmer Empire, Angkor in present day Cambodia. This study conducted between 2012-2013 revealed extensive urban landscape features around the famous Angkor Wat temple, which were previously barely known due to thick vegetation cover. The results of this study was also the subject of a lecture of ICOMOS Sri Lanka in 2018 by the lead researcher.
.")
.")
Lidar and the Archaeologist
The output of Lidar is the DEM or an extremely detailed reconstruction of the ground surface. The DEM can be used directly for spatial analysis in the GIS or to generate visualizations. The visualizations produce images. These images serve as sources of information which are then ÔÇÿreadÔÇÖ and interpreted by archaeologists. A very simplified workflow is thus:
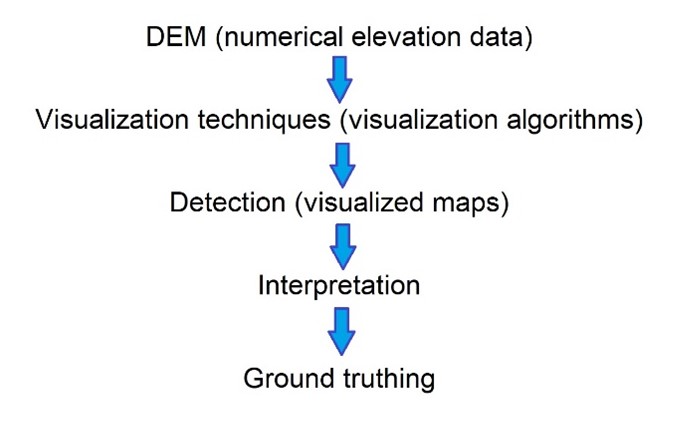
The LiDAR derived DEM is like any raster file. In the GIS software, it can be visualized through colour manipulation, histogram stretch, hillshade and 3D representations. Furthermore, advanced visualizations are also available through other applications; these are for example, sky-view factor, local dominance, negative and positive openness, cumulative visibility etc. and can be created through the Relief Visualization Toolbox (RVT) application of the Research Centre of the Slovenian Academy of Sciences and Arts. The choosing of the type of visualizations depends on the topography of the site, where ideally more than two visualizations can be used to derive different images for comparison.
The next step will be more familiar to the archaeologist – detection and interpretation. The resulting image can be read like a map, where then depending on the experience of the archaeologist, potential archaeological features can be traced out. However, the very final step in any LiDAR survey should be ground truthing. The typical archaeological field survey would be conducted, but with the LiDAR maps helping to pinpoint specific locations and giving an overall landscape perspective of the terrain being surveyed.

Application of LiDAR in Sri Lanka
The use of LiDAR in Sri Lankan archaeology was first pioneered in 2017-2018 with the ÔÇÿDigitizing Our HeritageÔÇÖ project. This project was a collaboration between the Commonwealth Scientific and Industrial Research Organization (CSIRO) of Australia, the private 3D printing firm RCS2 Technologies, the University of Moratuwa, and the Department of Archaeology.
This project used drone based LiDAR for mapping and documenting important archaeological sites using the Hovermap, a 3D LiDAR mapping system developed by CSIRO. The sites included Sigiriya, Dambulla cave temple, Thuparamaya, Isurumuniya, Mudukondapola, Nikasalanuwara, Kandegama, Galle fort and several sites in Polonnaruwa.
The system created a digital map of the monument which was next used to print 3D models, which will be of immense use for heritage professionals. This however is an example of one of the applications of LiDAR ÔÇô that of digitizing monuments.
The second and most important use of LiDAR or more specific ÔÇô Airborne Laser Scanning, for surveying studies has seen a lack in Sri Lankan archaeology.
A literature study showed no known research which employed LiDAR for archaeological prospection. This is understandably due to the high cost involved in using an aircraft for scanning. However, possibly unbeknownst to many in the heritage field, the Survey Department of Sri Lanka has had LiDAR data since 2015!
Survey Department data
Airborne LiDAR data has been made available by the Survey Department since 2015 covering seven districts thus far (complete districts of Colombo, Gampaha, Kegalle, Nuwara Eliya and parts of Kalutara, Kandy and Badulla), at pixel resolutions of 1x1m for Colombo and Gampaha and 2x2m for the rest (see map below). The department conducted the LiDAR survey through a collaboration with Japan, and hopes to extend the survey to the rest of the country. These data were mainly created for disaster risk management and geospatial information.
Procuring this data from the Survey department is quite easy. LiDAR data are provided in the formats of DEM, DSM (Digital Surface Model), Point Cloud, Contours, and Rapid Ortho Photo. These are priced per square kilometer (see price list below).
Procedure ÔÇô One could simply send an email to surveydepartment.csc@gmail.com giving the required location and area, and once the requirement is confirmed and quotation sent, you could make the payment to the bank and upon sending confirmation of payment, you will receive the data via email in a few daysÔÇÖ time. As the below case study will show, I received this within less than a week and the staff of the department were very prompt in handling my request. Since I made the payment online, the data was obtained completely online without ever having to go to the department.

This has since been updated and now contains coverage of the entire Nuwara Eliya District.

Case study of Balana
Having studied extensively on LiDAR visualizations during my masters in Amsterdam, I was curious on its possibilities in Sri Lanka. ThatÔÇÖs when during my thesis work I came to know of the existence of LiDAR with the Survey Department. Visiting the department last year I was told of its availability and procurement procedure, which I have described above after my experience.
Elated over the fact that the department had LiDAR coverage over the site of Balana fort, I immediately sent a request for an area of 46.2 hectares or 0.46 sqkm and received the DEM via email. Balana is a site I have long been involved with, having drawn possibly the first archaeologically surveyed map of the fort, and had always wished to view the sitesÔÇÖ terrain for more detailed analysis.
The results showed the main fort in clear visibility of its surroundings and allows for an understanding of the terrain that would not have been possible before. In a conventional topographic survey using a total station, it would have taken several field days to produce a terrain model, and that too without much detail of the steep slopes. However here, within virtually a day of procurement and within about an hour of visualization, I was able to see the topography of the fort, i.e. the hill of Balana and its surroundings in astonishing detail; all at the price of Rs. 46.00.
Due to the relatively low resolution of the LiDAR data, not much of the micro topography or smaller archaeological features were visible; however, I was able to identify a large trench like feature along the north-east end of the fort.
The results of this LiDAR survey of the Balana fort will be presented at the National Archaeology Conference 2022 organized by the Department of Archaeology.


")
Suitability of the Survey Department LiDAR and future potential for Sri Lanka
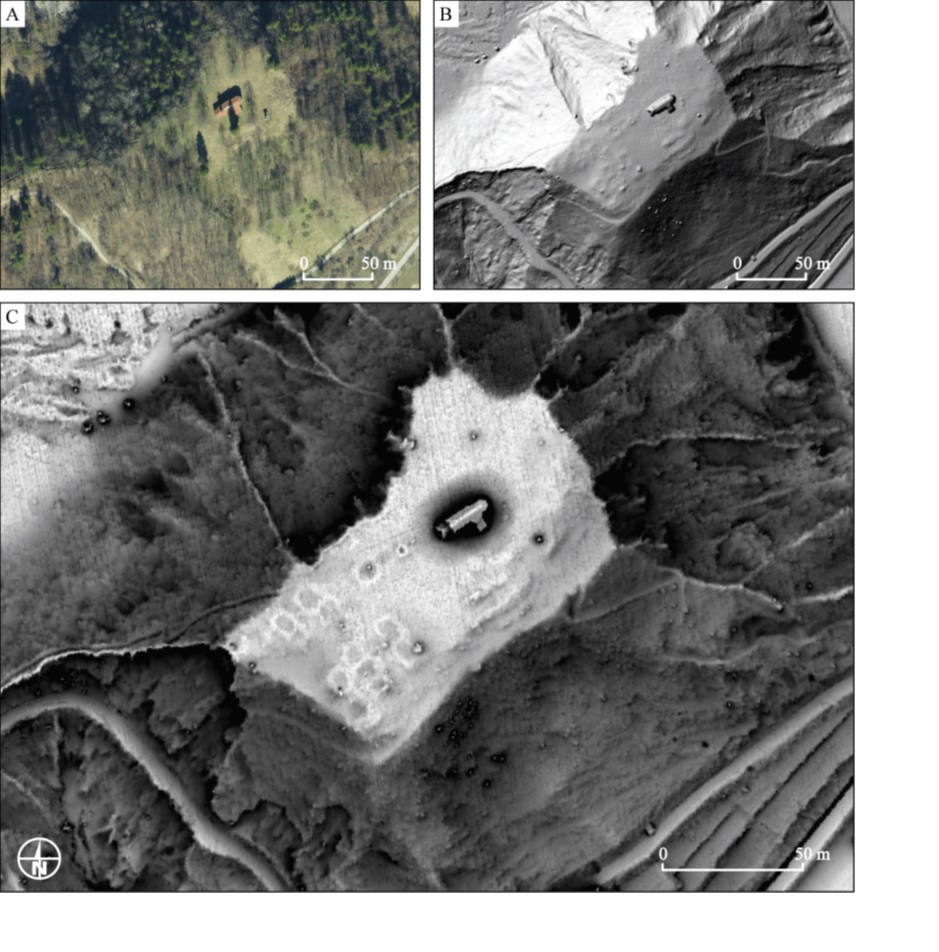
Apart from the analyses that could be derived from the LiDAR of Balana, it was mainly performed as a test to examine the suitability of 2×2 meter pixel DEMs for archaeological prospection. In this regard it failed. High resolution LiDAR DEMs can reach 0.5 meters resolution, making this 2×2 meter relatively low resolution. In the case of Balana, a single-lined wall identified previously was not quite visible; even the main fortÔÇÖs outline is barely visible. This is in contrast to 0.5m DEMs (see below image) where micro features are quite visible.
Nevertheless, having LiDAR data to begin with is exciting, and the existing 2×2 meter resolution DEMs are still very useful as larger topographic features could be easily traced and analysed. As mentioned above, the best use of LiDAR is when its used for extensive areas under forest cover; and if project-specific airborne laser scanning surveys with powerful lasers are conducted, higher resolution data can be obtained for better results. Sri Lanka still has large swathes of lands under forest cover with known or little known archaeological sites, such as those of the Dry zone.
Surveying these with LiDAR would yield unique landscape results and help narrow down field surveying. Given the current cover of LiDAR data (see above for current districts) in Sri Lanka, these regions may not ring-a-bell for extensive archaeological sites, but as Balana has shown, many existing sites in the central highlands could still be examined in a new light.
Another interesting opportunity can be for the prehistorian, where the high resolution DEMs could be used for predictive modelling and viewshed analysis of the larger landscape of the prehistoric man.
It is hoped that this rather extensive ÔÇô brief introduction to LiDAR for archaeology in Sri Lanka would inspire researchers to embrace this new (freely available) technology and explore our understanding of the past even deeper. It has to be noted that this is a rather simplified introduction to LiDAR. For the more mathematically oriented archaeologist, the research would begin with the raw Point Cloud data where the margin of error could be established for more scientifically oriented results.
 visualization")
Comparison of same location between Google Satellite image and Simple Local Relief Model (SLRM) visualization, of an area southeast of Besan├ºon, France. This was part of the writerÔÇÖs Lidar assignment of the University of Amsterdam. Visualizations based on 0.5m resolution DEM. Image shows 2 prominent burial mounds to the left, and 4 mounds to the right. A square shaped archaeological feature can also be seen between the 2 prominent mounds.
References
- Max van der Schriek & Willem Beex, 2017. ÔÇ£The application of LiDAR-based DEMs on WWII conflict sites in the NetherlandsÔÇØ, Journal of Conflict Archaeology, 12:2, 94-114, DOI: 10.1080/15740773.2017.1440960
- Davis, S. et al. 2010. Boyne Valley Landscapes Project. Phase III Summary Report. Dublin, University College Dublin.Bofinger, J. & R. Hesse, 2011. As far as the laser can reach Laminar analysis of LiDAR detected structures as a powerful instrument for archaeological heritage management in Baden
- W├╝rttemberg, GermanyÔÇØ. In: Cowley, D.C. (ed.), Remote Sensing for Archaeological Heritage Management. Brussels, EAC, pp. 161-171.
- Opitz, R., L. Nuninger & C. Fruchart, 2012. ÔÇ£Thinking topographically about the landscape around Besan├ºon (Doubs, France)ÔÇØ. In: Kluiving, S.J. & E.G.B. Guttmann, (eds.), Landscape Archaeology between Art and Science. From a Multi- to an Interdisciplinary Approach. Amsterdam, Amsterdam University Press, pp. 395-412.
- Chase, A.F., D.Z. Chase & J.F. Weishampel, 2013. ÔÇ£The Use of LiDAR at the Maya Site of Caracol, BelizeÔÇØ. In: Comer, D.C. & M.J. Harrower (eds.), Mapping Archaeological Landscapes from Space. New York, Springer, pp. 187-197.
- Evans, D.H. et al., 2013. ÔÇ£Uncovering archaeological landscapes at Angkor using lidarÔÇØ. PNAS 110 (31): 12595ÔÇô12600.
- Gunaratne, Najira., 2017. ÔÇ£Preserving Our History with LidarÔÇØ. Roar Media [online] Available at: https://roar.media/english/tech/insights/preserving-our-history-with-lidar
- Daniel, Shannine., 2018. ÔÇ£Digitizing Sri LankaÔÇÖs Heritage for TomorrowÔÇÖs GenerationsÔÇØ. Roar Media [online] Available at: https://roar.media/english/life/in-the-know/digitizing-sri-lankas-heritage-for-tomorrows-generations
- Course materials for elective ÔÇÿTutorial Archaeology and GISÔÇÖ, MA and RMA programme, 2019/2020, Faculty of Humanities, University of Amsterdam.